11 Best Practices to Optimize Snowflake ❄

Snowflake’s powerful platform is architecturally different from almost every traditional database system and cloud data warehouse. Snowflake has completely separate compute and storage, and both tiers of the platform are near-instantly elastic. The need to do advanced resource planning, agonize over workload schedules, and prevent new workloads on the system due to the fear of disk and CPU limitations just go away with Snowflake. As a cloud data platform, Snowflake can near-instantly scale to meet planned, ad hoc, or surprise growth. This means instead of paying for a fixed, limited amount of storage and compute, the amount of storage and compute grows and shrinks as your needs change over time.
By taking advantage of a core tenet of the cloud, elasticity and compute can be dynamically scaled to workloads throughout the day as concurrency needs or raw compute power fluctuate to meet demand. Storage will grow and shrink over time for databases, tables, and meta-data. There are a few optimizations every Snowflake account administrator should make and some more-advanced methods you should consider as your Snowflake compute footprint grows. Because compute and storage are separated and are elastic, these resources should be monitored for consumption, surprise growth, and resource efficiency.
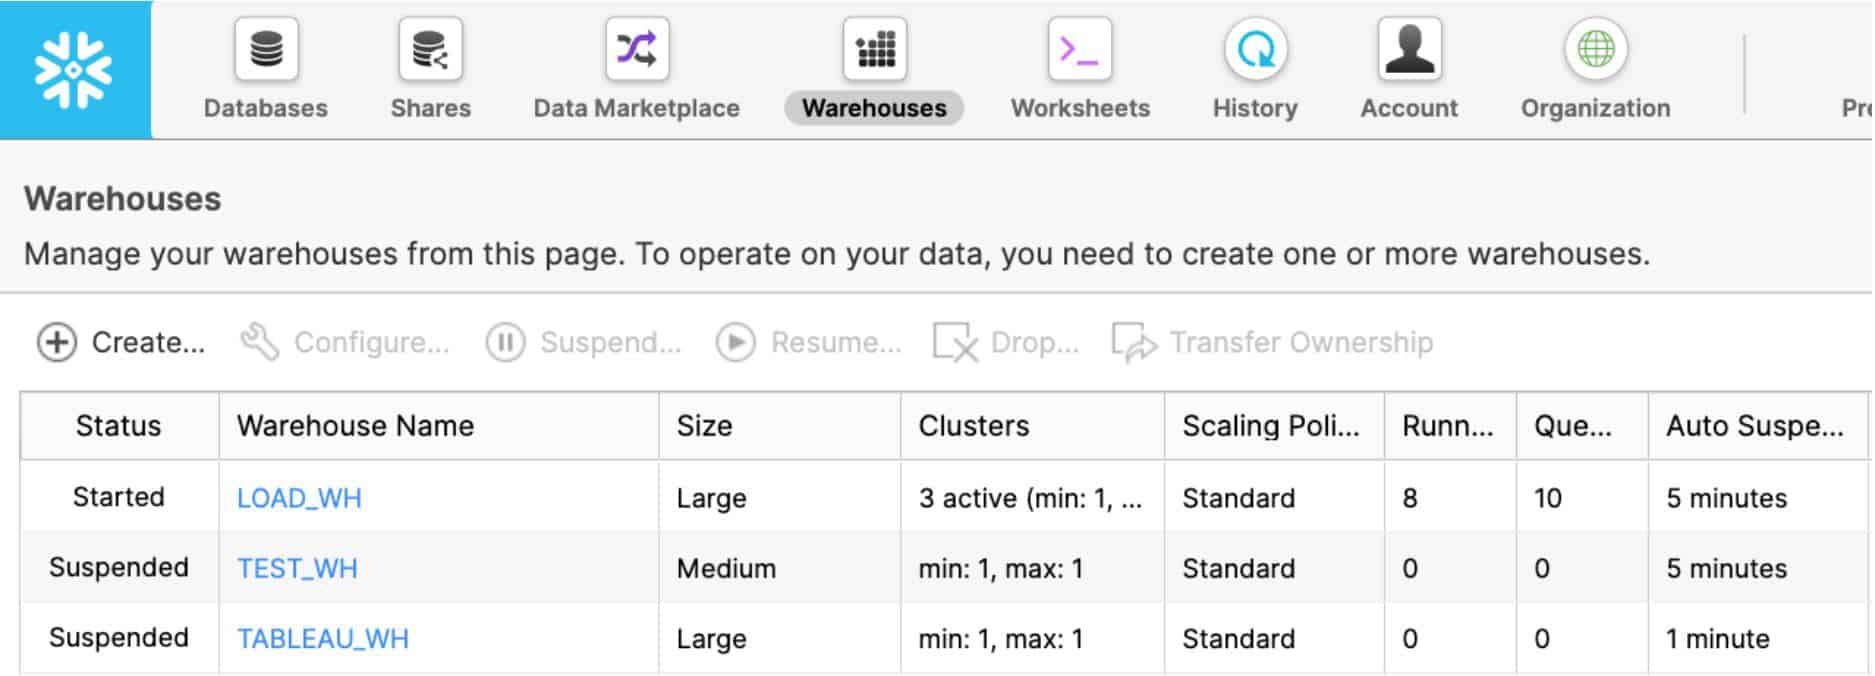
Snowflake is virtually unlimited by default, and administrators can put in place minor account-level and resource-level restrictions to defend against rogue users or suboptimal use of resources and credits. For example, you can proactively control compute at the individual virtual warehouse level, at the user level, or at the account and organization level through resource monitors. Users, databases, tables, queries, and workloads can be monitored through the ACCOUNT_USAGE schema shared with all Snowflake accounts. The following figure shows the status and basic configuration of virtual warehouses in an account:
Given all this, here are 11 best practices Snowflake account administrators should be doing.
Best Practice 1: Enable Auto-Suspend
Make sure all virtual warehouses are set to auto-suspend. This way, when you are done processing queries, auto-suspend will turn off your virtual warehouses when you are done processing queries, and thus stop credit consumption. Run the following query to identify all the virtual warehouses that do not have auto-suspend enabled.
Best Practice 2: Enable Auto-Resume
Make sure all virtual warehouses are set to auto-resume. If you are going to implement auto-suspend and set appropriate timeout limits, enabling auto-resume is a must; otherwise, users will not be able to query the system. Run the following to identify all the virtual warehouses that will not auto-resume when they are queried:
Best Practice 3: Set Timeouts Appropriately for Workloads
All virtual warehouses should have an appropriate timeout for their particular workload:
- For task, data loading, and ETL/ELT warehouses, set the timeout for suspension immediately upon completion.
- For BI and SELECT query warehouses, set the suspension timeout to 10 minutes in most situations to keep data caches warm for frequent access by end users.
- For DevOps, DataOps, and data science warehouses, set the suspension timeout to 5 minutes because having a warm cache is not as important for ad hoc and highly unique queries.
Best Practice 4: Set Account Statement Timeouts
Use the STATEMENT_QUEUED_TIMEOUT_IN_SECONDS and STATEMENT_TIMEOUT_IN_SECONDS parameters to automatically stop queries that are taking too long to execute, either due to a user error or a frozen cluster. Customize warehouse, account, session, and user timeout-level statements according to your data strategy for long-running queries.
Here’s an example:
ALTER WAREHOUSE LOAD_WH SET STATEMENT_TIMEOUT_IN_SECONDS= 3600;rnSHOW PARAMETERS IN WAREHOUSE LOAD_WH;
Best Practice 5: Identify Warehouses Deviating from the Seven-Day Average
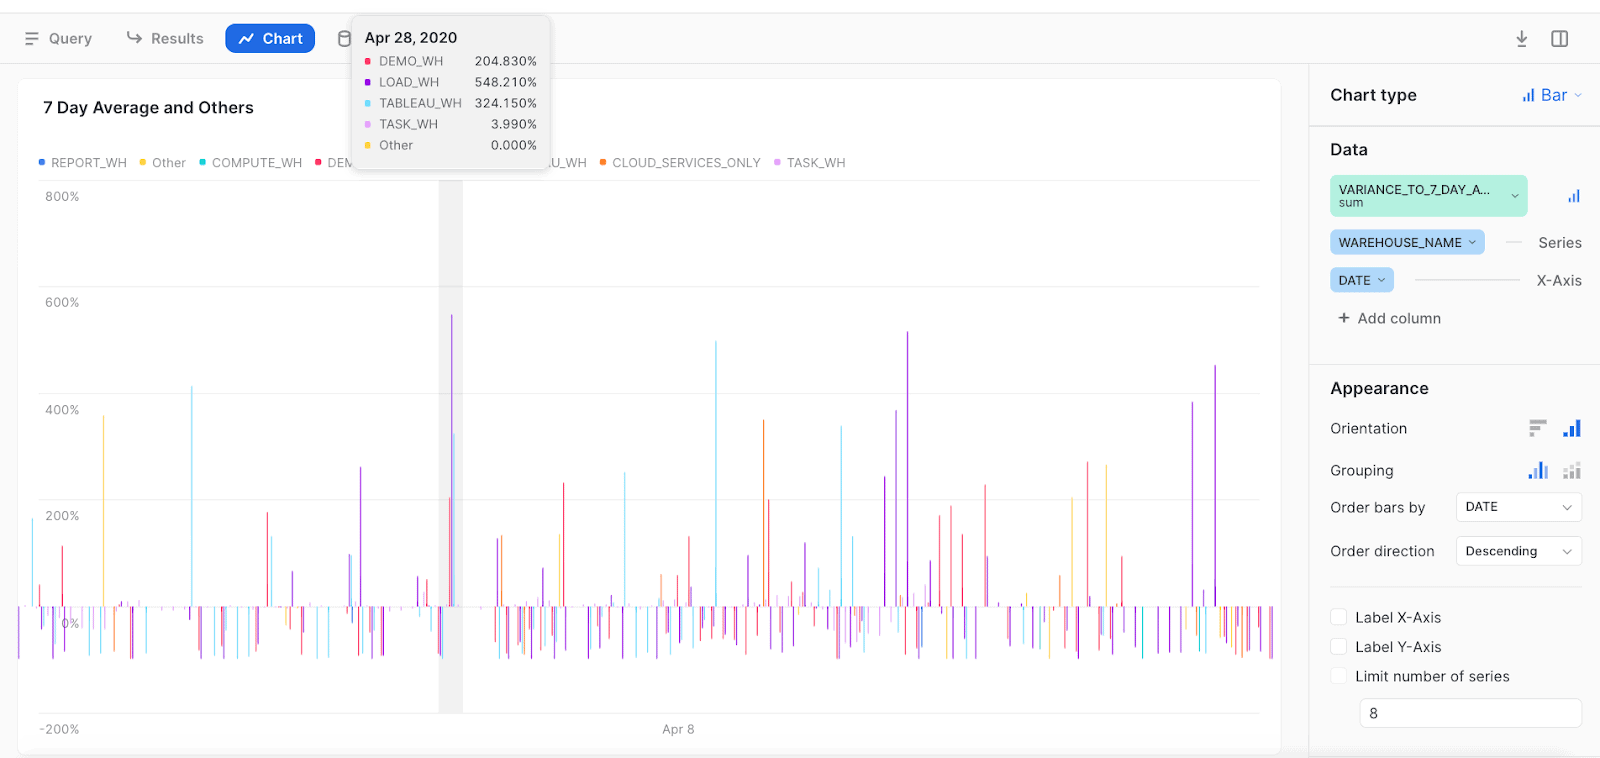
Here’s a handy tip that came from a direct interaction I had with a customer who set a warehouse to a larger size to do a task but did not put it back the way he found it. I made the following query for him to run every morning to identify warehouse credit usage that deviates from the seven-day average. The following figure shows the results of running the query.
Best Practice 6: Monitor Warehouses That Are Approaching the Cloud Service Billing Threshold
The following query looks at warehouses where cloud services costs comprise a high percentage of the workload. Overall for an account (and outside of serverless features), Snowflake will charge for cloud services only if they exceed 10% of the daily virtual warehouse credit consumption. Cloud services tasks are useful for meta-data operations such as BI tool discovery queries, heartbeat queries, SHOW commands, cache usage, and several other service optimizing features. So if you use 100 compute credits in a day, but you use 15 additional credits for cloud services (unlikely), you will be charged an additional 5 credits for that day for the 5 cloud service credits that were over the 10% allowance. This means 105 credits total would be billed for the day with Snowflake providing 10 free credits of cloud services usage. This query helps you figure out which warehouses are nearing or exceeding that 10% threshold so that you can investigate.
Best Practice 7: Drop Unused Tables
You might have unused tables that are candidates to be dropped. Just make sure no one is querying these tables. In fact, you might want to make it mandatory to check all tables before deletion. (If you have Time Travel set up, you can undrop a table if you make an error.) This is specific to the database context, so be sure to look at tables across your databases. Also, be mindful of tables used only in view DDLs.
Best Practice 8: Purge Dormant Users
It’s a good idea to purge from your account dormant users or users that never logged in to Snowflake.
Guardrails for Automatic Scaling
Real-life usage of a data platform varies significantly from hour to hour, day to day, and month to month. By default, Snowflake is designed to scale automatically and provide maximum performance and efficiency. However, some workloads are better served by static and highly predictable resources, and Snowflake can easily be configured to provide that consistent consumption model for every day of the year. By implementing a few account-level and resource-level restrictions, account admins can prevent unexpected usage by careless users or suboptimal scaling profiles:
- Through resource monitors, admins can receive proactive alerts and control compute at the account level, virtual warehouse level, and even the user level.
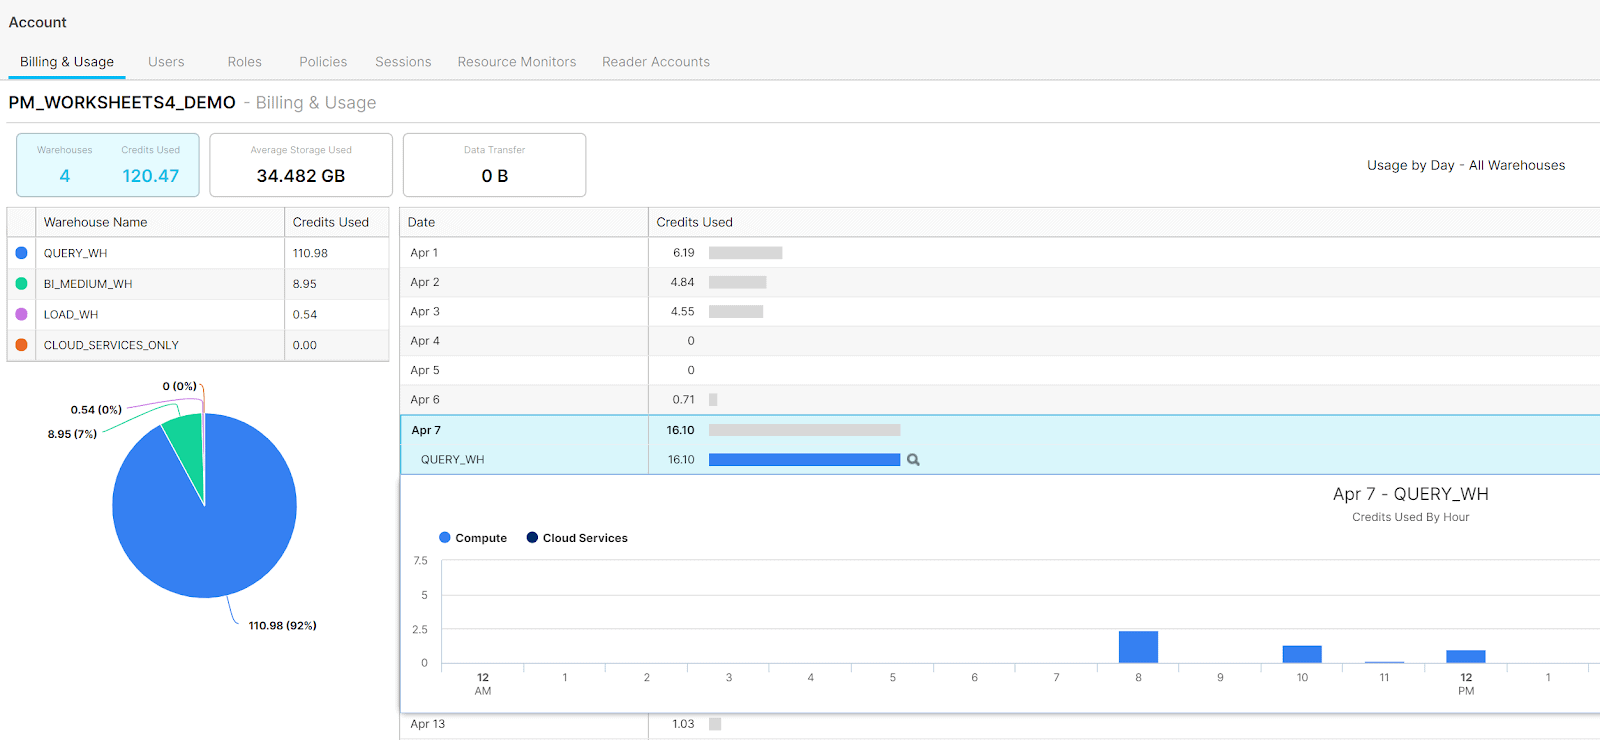
- On a reactive basis, admins can monitor users, databases, tables, queries, and workloads through the ACCOUNT_USAGE schema shared with all Snowflake accounts. This data is commonly used to forecast usage trends and provide showback and chargeback billing for departments, teams, and workloads. Daily usage metrics are built into the platform for both individual users, account administrators, and organization administrators. This figure shows the built-in dashboard providing an hourly breakdown of credits for both compute and cloud services:
Best Practice 9: Find Warehouses That Don’t Have Resource Monitors
Resource monitors are a great way to proactively control workload budgets and prevent unexpected resource spikes. Resource monitors can help monitor both user usage and service account usage in Snowflake. First, you should have dedicated virtual warehouses for each of your loading, ELT, BI, reporting, and data science workloads as well as for other workloads. Accounts and warehouses can have total, yearly, monthly, weekly, and daily credit quotas.
Best Practice 10: Apply Resource Monitors
You can use the UI or SQL to apply your resource monitor policy. Based on account preference settings, resource monitors can notify you when consumption reaches a lower threshold, and then suspend the warehouse or account at a higher threshold.
Considerations for Resource Monitoring
- We recommend setting monitors to notify you when a certain threshold of consumption is reached.
- When consumption approaches the maximum budgeted level, set the resource monitor to auto-suspend the warehouse or the entire account, allowing queries to complete but preventing future requests.
- Resource monitors can also be used to terminate all currently running queries and immediately suspend the resource or account. This setting is usually reserved for situations where a hard quota is exceeded.
- For customers that do not want to set hard limits, it’s still always a good idea to have notification monitors set on all warehouses in case usage unexpectedly spikes. That way, all admins within the account will get an email or on-screen notification when thresholds are reached.
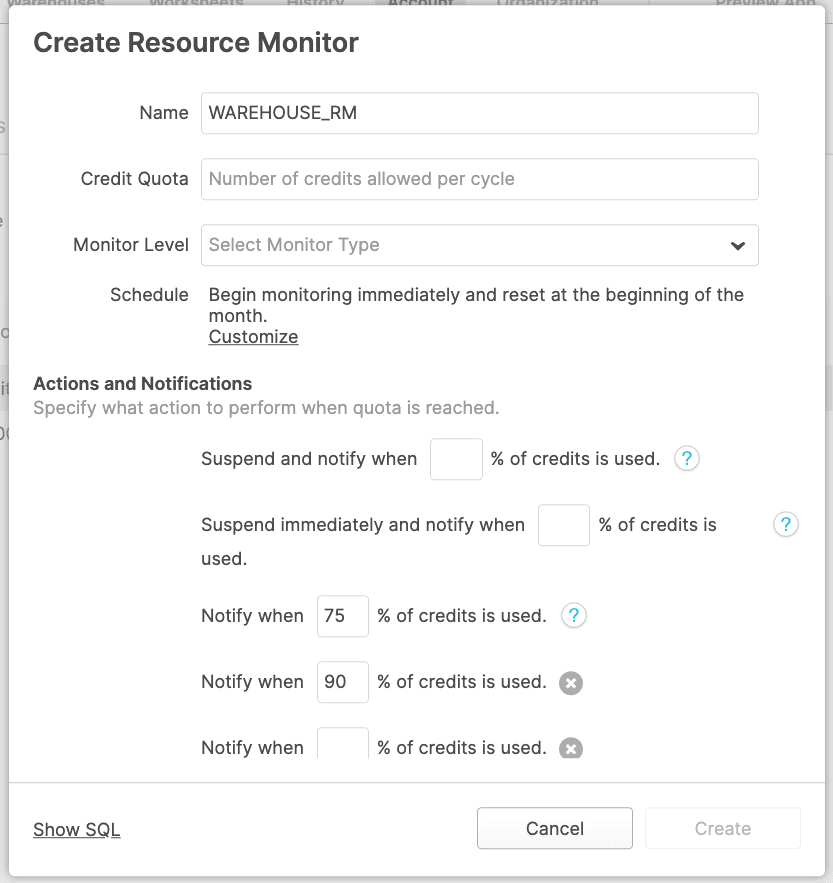
The following figure shows the resource monitor configuration screen:
Best Practice 11: Use the Astrato Snowflake Usage workbook
The team at Astrato put together a workbook looking at compute costs, user uptick, and performance. Astrato ships with this dashboard displaying your Snowflake account usage data. Quickly dive into understanding and optimizing your organization’s Snowflake usage.
![snowflake-workbook[1].png](https://us.v-cdn.net/6036206/uploads/FC3Y2C6DCVZZ/snowflake-workbook-5b1-5d.png)
With Snowflake’s highly elastic compute and per-second billing model, account administrators should monitor usage, growth, and resource efficiency on an ongoing basis to make sure you match performance requirements and budgets. Even though Snowflake can help to optimize resources automatically, there are opportunities for account administrators to further tune your deployment, especially as your compute footprint grows. We recommend these basic best practices for monitoring and optimizing resources to avoid common pitfalls that are easy to overlook.
